EFFECTS OF US INTEREST RATE POLICY ON THE STOCK MARKET
April 25, 2022 2022-04-25 19:25EFFECTS OF US INTEREST RATE POLICY ON THE STOCK MARKET

ECONOMIC OVERVIEW
Early this year, the US Federal Reserve set a goal of an unprecedented interest rate hike. It comes after a sustained and erratic inflation rate that hinders consumers’ purchasing power, driven by increasing commodity prices and rising global tension.
Outside the US, Inflation has been a concern for many economies worldwide. Moreover, the COVID-19 pandemic, which started in early 2020, has left countries with no better alternative than to embark on some form of Government financial assistance to their population. However, it has not come without long-term repercussions. It has caused many economies to adopt aggressive inflationary fiscal and monetary policies to support their citizens and alleviate the rising financial pressure caused by widespread global lockdown, mass unemployment, and defaulting businesses.
In the US, one of these financial assistance programs is famously known as the “Stimulus Package.” Where the US Federal Reserve, under pressure from both influential Policy Makers and average citizens, has, among other things, printed the most US dollars in its entire history of existence. The immediate effects brought relief to the population and economy. In contrast to many Economists’ estimates, the US Stock Market rallied. Most financial markets around the world followed this while the pandemic at that time was worsening. In retrospect, it was the euphoria before the storm. While all of this is happening, many ordinary citizens have used their stimulus package to bet and invest in different Financial Markets. In hindsight, it can be viewed as a desperate attempt to offset their losses brought by massive unemployment and almost no way in sight of recovery. It fueled the euphoria and caused the Financial Markets to surge. At a macro level, regardless of how bad the COVID-19 pandemic was, the Financial Markets are and will remain a market driven by the demand-supply economic model; thus, multiple indices that follow the Financial Markets worldwide have surged.
THE STORM HAS STARTED (2020 TO 2021)
In this section, we will explore the effects of implementing the interest rate hike on the US Financial Markets, together with global markets around the world.
“Strong demand for goods might not be sustained” – US Federal Reserve.
US Personal Consumption Expenditures (PCE) – Durable Goods/Services Defined as a measure of the prices that people living in the United States, or those buying on their behalf, pay for goods and services. The change in the PCE price index is known for capturing inflation (or deflation) across a wide range of consumer expenses and reflecting changes in consumer behavior.
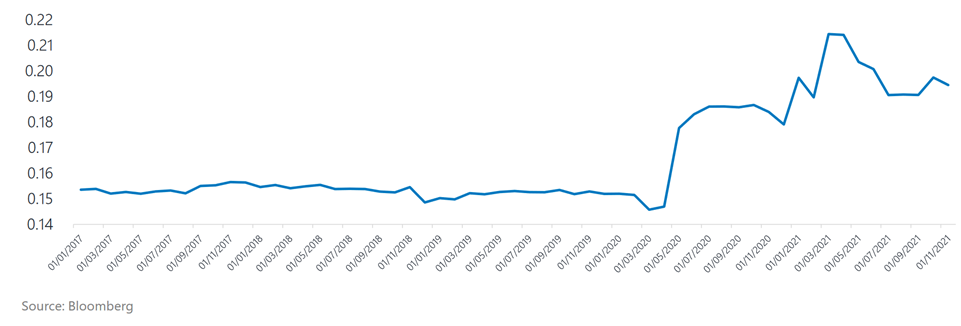
From January 2017 to March 2020, the US PCE has consistently ranged from 0.15 to 0.16. However, this was before the COVID-19 pandemic. Starting in April of 2020, it picked up 300 basis points in three months to an all-time high of 0.19. Eventually, it tapered off before the year ended at 0.18. However, starting in 2021, it kicked off another 300 basis points within three months, with a new high of 0.21. Coinciding with these rising prices, ordinary US citizens feel the imminent real-world effect of rising inflation. Furthermore, this is where the US Federal Reserve first introduced a substantive interest rate hike to attempt to ease the inflationary effect brought by aggressive and unprecedented financial assistance/stimulus injected into the economy.
US Institute of Supply Management (ISM) New Orders/Inventory
US’s Institute for Supply Management (ISM) is the oldest and largest non-profit organization that serves professionals employed in supply management. It surveys purchasing managers in the manufacturing sector about their new orders and inventory.
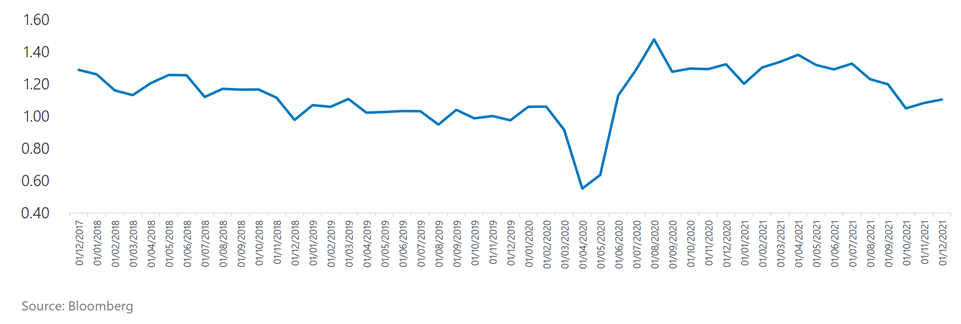
As shown, the sharp correction in April of 2020 coincides with the start of the negative effect brought by the COVID-19 pandemic. New orders and inventory have suffered a catastrophic decline from their normal levels (1.00 to 1.20) to 0.60 to 0.70 in April and May of 2020. It went up to its normal levels in June and made a new high in July of the same year before going back to its pre-pandemic levels. A minor decline in new orders is registered starting in the second half of 2021, where Interest Rates have negatively affected the consumer demand, incentivizing the US population to save than borrow, spend and invest in the Capital Markets.
US Consumer Sentiment Index (CSI) The US Index of Consumer Sentiment (ICS), introduced by the University of Michigan, tracks consumer sentiment in the US; based on surveys of random samples of US households. The index aids in measuring consumer sentiments in personal finances, and business conditions, among other topics. Historically, the index displayed pessimism in consumers’ confidence during recessionary periods and increased consumer confidence in expansionary periods.
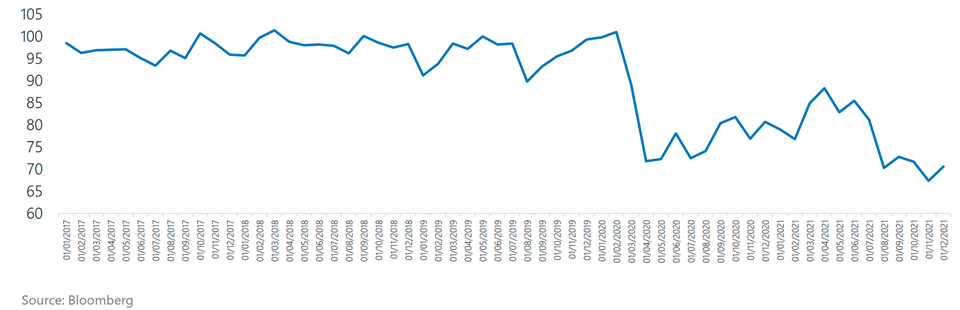
Surprisingly, the CSI started to deteriorate entering the year 2020. It is most likely caused by overseas supply chain issues brought by sanctions the US has implemented and the negative media coverage it received in the US. After a 25-level drop, it recovered throughout the starting phase of the pandemic in 2020 until the first half of 2021, when it hit 85 levels. It is to be expected as the FED implemented an aggressively expansionary policy alongside a comprehensive financial stimulus program that boosted the purchasing power of consumers. However, when the Federal Reserve started to shift toward increasing the interest rates, consumer behavior and sentiment reversed and, evidently reflected in CSI, hit a new low of 65-70 levels, which was lower than the pandemic’s start.
Commodity Research Bureau (CRB) Index
The index measures the aggregated price direction of various commodity sectors; this is designed to isolate and gauge the directional movement of prices in overall commodity trades.
US Dollar (DXY) Index The index reflects the dollar’s strength or weakness and is a pricing mechanism for many commodities.
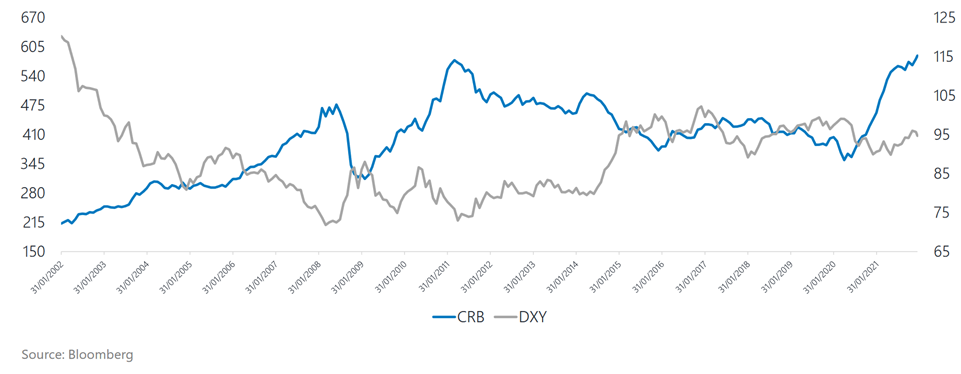
Historically, US dollars and commodity prices have an inverse relationship. The graph presented above shows that a strong dollar is not beneficial for commodity prices as it becomes less profitable to export in countries utilizing US dollars as a medium for trade, lowering the margins, and it becomes costly to import US-denominated commodities.
THE PRESENT REALITY (JANUARY 2022 TO PRESENT)
Global markets began correcting last February 11 in response to news that January inflation in the U.S. jumped to a new 40-year high of 7.5%. It raised concerns that the U.S. Federal Reserve would increase interest rates aggressively by 50 basis points in March and 175 basis points for the whole year. As of this writing (April 2022), the U.S. 10-year bond rate is now at 2.9%, around 140 basis points higher for the year-to-date period. It is also above its pre-pandemic level of 1.9%. The sharp rise in inflation triggered a significant increase in the U.S. bond rate. Subsequently, during the first two months of the year, average inflation in the U.S. hit a forty-year high of 7.7%.
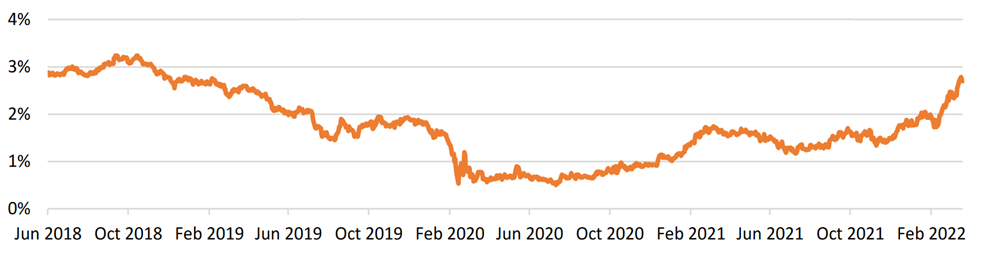
The 10-year US treasury yield jumped over 2.80%, its highest in three years. It poses upward pressure on the international bond rate worldwide.
US Indices in 2022
Global equity markets, including the U.S. market, are falling this year due to concerns about a more aggressive Fed rate hike. Let us look at the current levels of U.S. Indices to conclude the effects of rising interest rates so far in 2022.
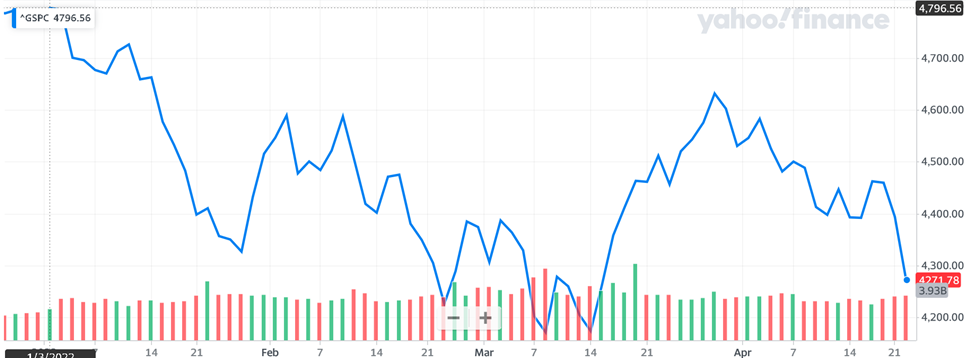
S&P 500
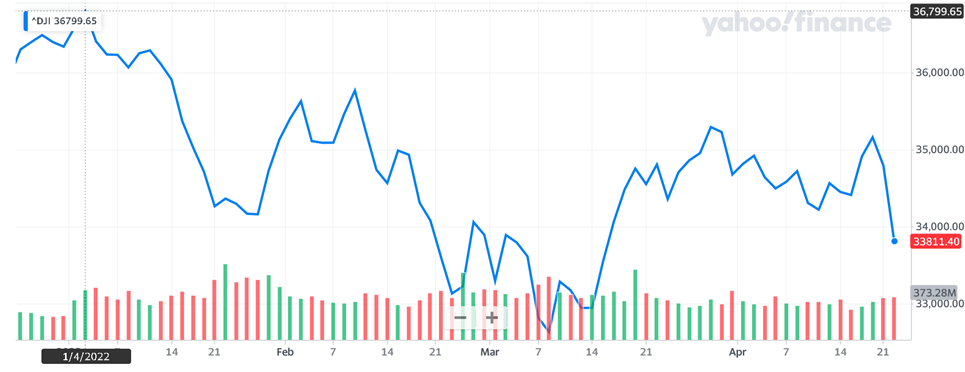
Dow Jones Industrial Average
Nasdaq 100
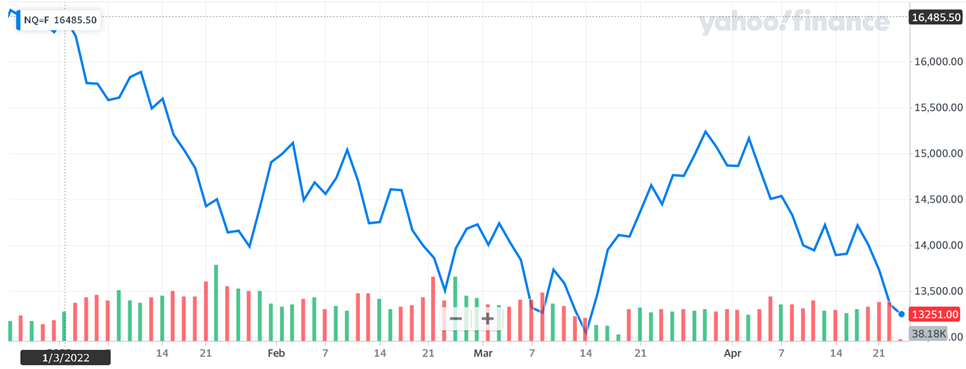
US Indices opened the year strongly with a high at the beginning of the year. The move of the S&P 500, Dow Jones Industrial Average, and Nasdaq mirror each other as they move in one fashion. S&P 500 was trading around 4700 to 4800 levels at the beginning of the year before suffering a 14% decline in the first quarter, early March. The Dow Jones Industrial Average followed the S&P 500, opening with a high of 36700 to 36800 level before suffering a 13% decline in the first quarter, early March. Lastly, NASDAQ opened with a high of 16400 to 16500 level and suffered the most significant loss of 18% market capitalization in two and a half months in the first half of March. However, in the second half of the same month, the indices rallied: S&P 500 rallied beyond the 4600 level, Dow Jones Industrial Average rallied to the 35000 level, and lastly, NASDAQ rallied to the 15000 level. These happened as optimism grew with the belief that the adverse effects brought by the US Federal Reserve interest hike in the Stock Market were already priced in. Nevertheless, as of this writing in April, we see that the indices are headed towards their previous low. The question remains, will it bounce back or set a new low for this year?
THE LIGHT AT THE END OF THE TUNNEL
Historically, US market went up even with higher rates
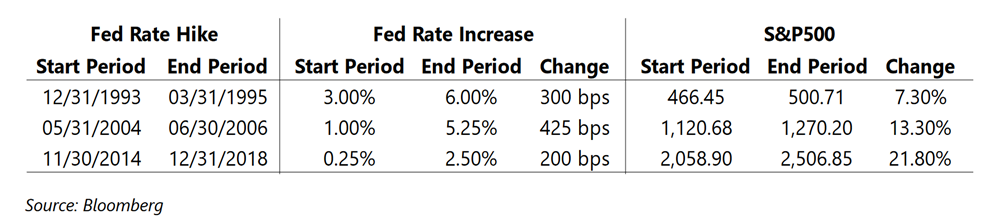
From an optimistic perspective, since the 1990s, the U.S. market managed to withstand the odds when the Fed began its tightening cycle. Coupled with corporate earnings recovery during the early economic cycles, it more than offset the negative impact of higher funding costs. For example, from the end of December 1993 to the end of March 1995, the S&P 500 increased by 7.3% even as the Fed raised rates by 300 basis points. Meanwhile, from the end of May 2004 to June 2006, the S&P 500 rose by 13.3% despite the 425 basis points increase in Fed fund rates. Finally, from the end of November 2014 to 2018, the S&P 500 jumped by 21.8%, even with the 225 basis points increase. Like any other economic turmoil, this phase is challenging yet, for the most part, expected. History is on our side unless another black swan event occurs.